I. Design Process
Problem Statement
How might we identify business opportunities for WindStax from unmet user needs?
Through rapid research and modeling methods, my team was challenged to quickly survey WindStax's competitive landscape and hone in on a focus area. We started with a stakeholder map and value flow diagram to visualize the stakeholders and interactions.
Competitive Analysis
I led the effort to identify market need by surveying the service offerings of similar companies to identify common pain points
To help my team prioritize a user and narrow down to a focus, I conducted my own research into top microgrid companies to understand their business platforms and competitive advantages.

💡key takeaway💡
Because of the unpredicatable nature of weather, a key challenge of microgrid systems is to manage energy inputs and outputs. All of the largest and most trusted energy microgrid providers include software to address this controls problem.
Analogous domain + Semi-structured interviews
Understanding the challenges of self-generated energy
In lieu of speaking with actual WindStax customers, as many of them live on remote farms and were inaccessible to my class, I spoke with 3 solar power owners to understand their challenges and concerns. Three themes emerged:
🕛 Timing
Because weather is unpredictable, users must try to predict when are the best times to use electrically-demanding equipment.
"I hope it doesn't keep tripping up the fuse box when I use the washing machine in the daytime with the AC going."
💵 Tracking Investments
Renewable energy is a big investment, especially for individual homeowners. Users feel anxious to see their investments pay off.
"I'm not sure if the panels will save me enough money on my energy bill to pay off the loan I took out."
🔧 Scheduling maintenance
Scheduling maintenance is a pain, as sometimes the city, company, and owners need to line up schedules.
"I needed to upgrade the ampage of the power wires, but it took forever because people from the company and city were showing up at different times, especially with traffic."
Persona
WindStax created the word "prosumer" to describe their customers, who are the unique position of being both the consumer and producer of their energy through mini wind and solar farms. In order to be as efficient as possible and avoid paying to use backup grid power, they must make adjustments to their use based on available energy production.

DESIGN BRIEF
How might we help prosumers monitor their energy levels in order to use energy in a more efficient way?
Based on our rapid research activities, we converged on the design goal of designing a data-driven service to help users track their system performance and make any necessary changes to their usage.
Starting from Scratch
Using jobs-to-be-done to structure the user flow
I launched our ideation phase by listing the various jobs-to-be-done under the scope of our design brief and sorting them by time-sensitivity to begin structuring the task flow and information architecture.
Jobs-to-be-done

Task flow

I made the assumption that the goals that are most time-sensitive, such as fixing a broken system, would need to be seen first and therefore placed prominently on the home screen. We later tested this assumption with the low fidelity prototype.
Ideation
Rapid parallel prototyping
My team ideated on approaches to the design brief with parallel prototyping. From this divergence of ideas, we were able to select the most promising design directions to iterate on.

💡Takeaway from testing 💡 Users need to see their most pressing issues and notifications first. Instead of making them dig for the information by deciphering a chart or navigating to another page, we decided to put the overall notifications and simple status updates on the homepage.
Low fidelity Wireframe
Structuring the information around context-based needs
Next, I layed out initial wireframes from the task flow my team agreed on so that we could visualize the flow and structure of the app. My teammates then augmented the layout with specific features on the homepage such as viewing progress on the gamified energy goals, weather info, and environmental impact overview as a daily dose of positivity and encouragement toward sustainability.
I also iterated on the fidelity of the energy flow screen, which serves as a central hub to view the energy inputs and outputs at-a-glance.

Learning from testing
Streamline the central purpose of the app
From two rounds of testing and heuristic evaluation, the most resounding feedback we received was to narrow our focus to one goal instead of pulling the user in multiple directions. This led us to ask ourselves:
- What is the core functionality of the app?
- What are the potential benefits to the user? Can I articulate this value in 2-3 core features?
We therefore refocused our design's core value add as:
- Immediate notifications about how to address time-pressing issues
- Informative data and personalized tips given unique energy usage history
Value Proposition
The Three M's: Monitor, Maintain, and Modify
GridControl's data-driven alerts and recommendations make it easy to keep your microgrid working at peak performance. The service was designed to give you access to both the data in a digestible visual format and qualitative evaluations which make it easy to understand what actions to take to optimize your energy production and consumption.

I came up with these categories according to specific user goals derived from our WindStax prosumer persona. Given the numerous different features within our prototype, I found these categories useful to link together all of the different pages and provide a framework to pitch the design. Many of the pages contain features which fall into more than one category.
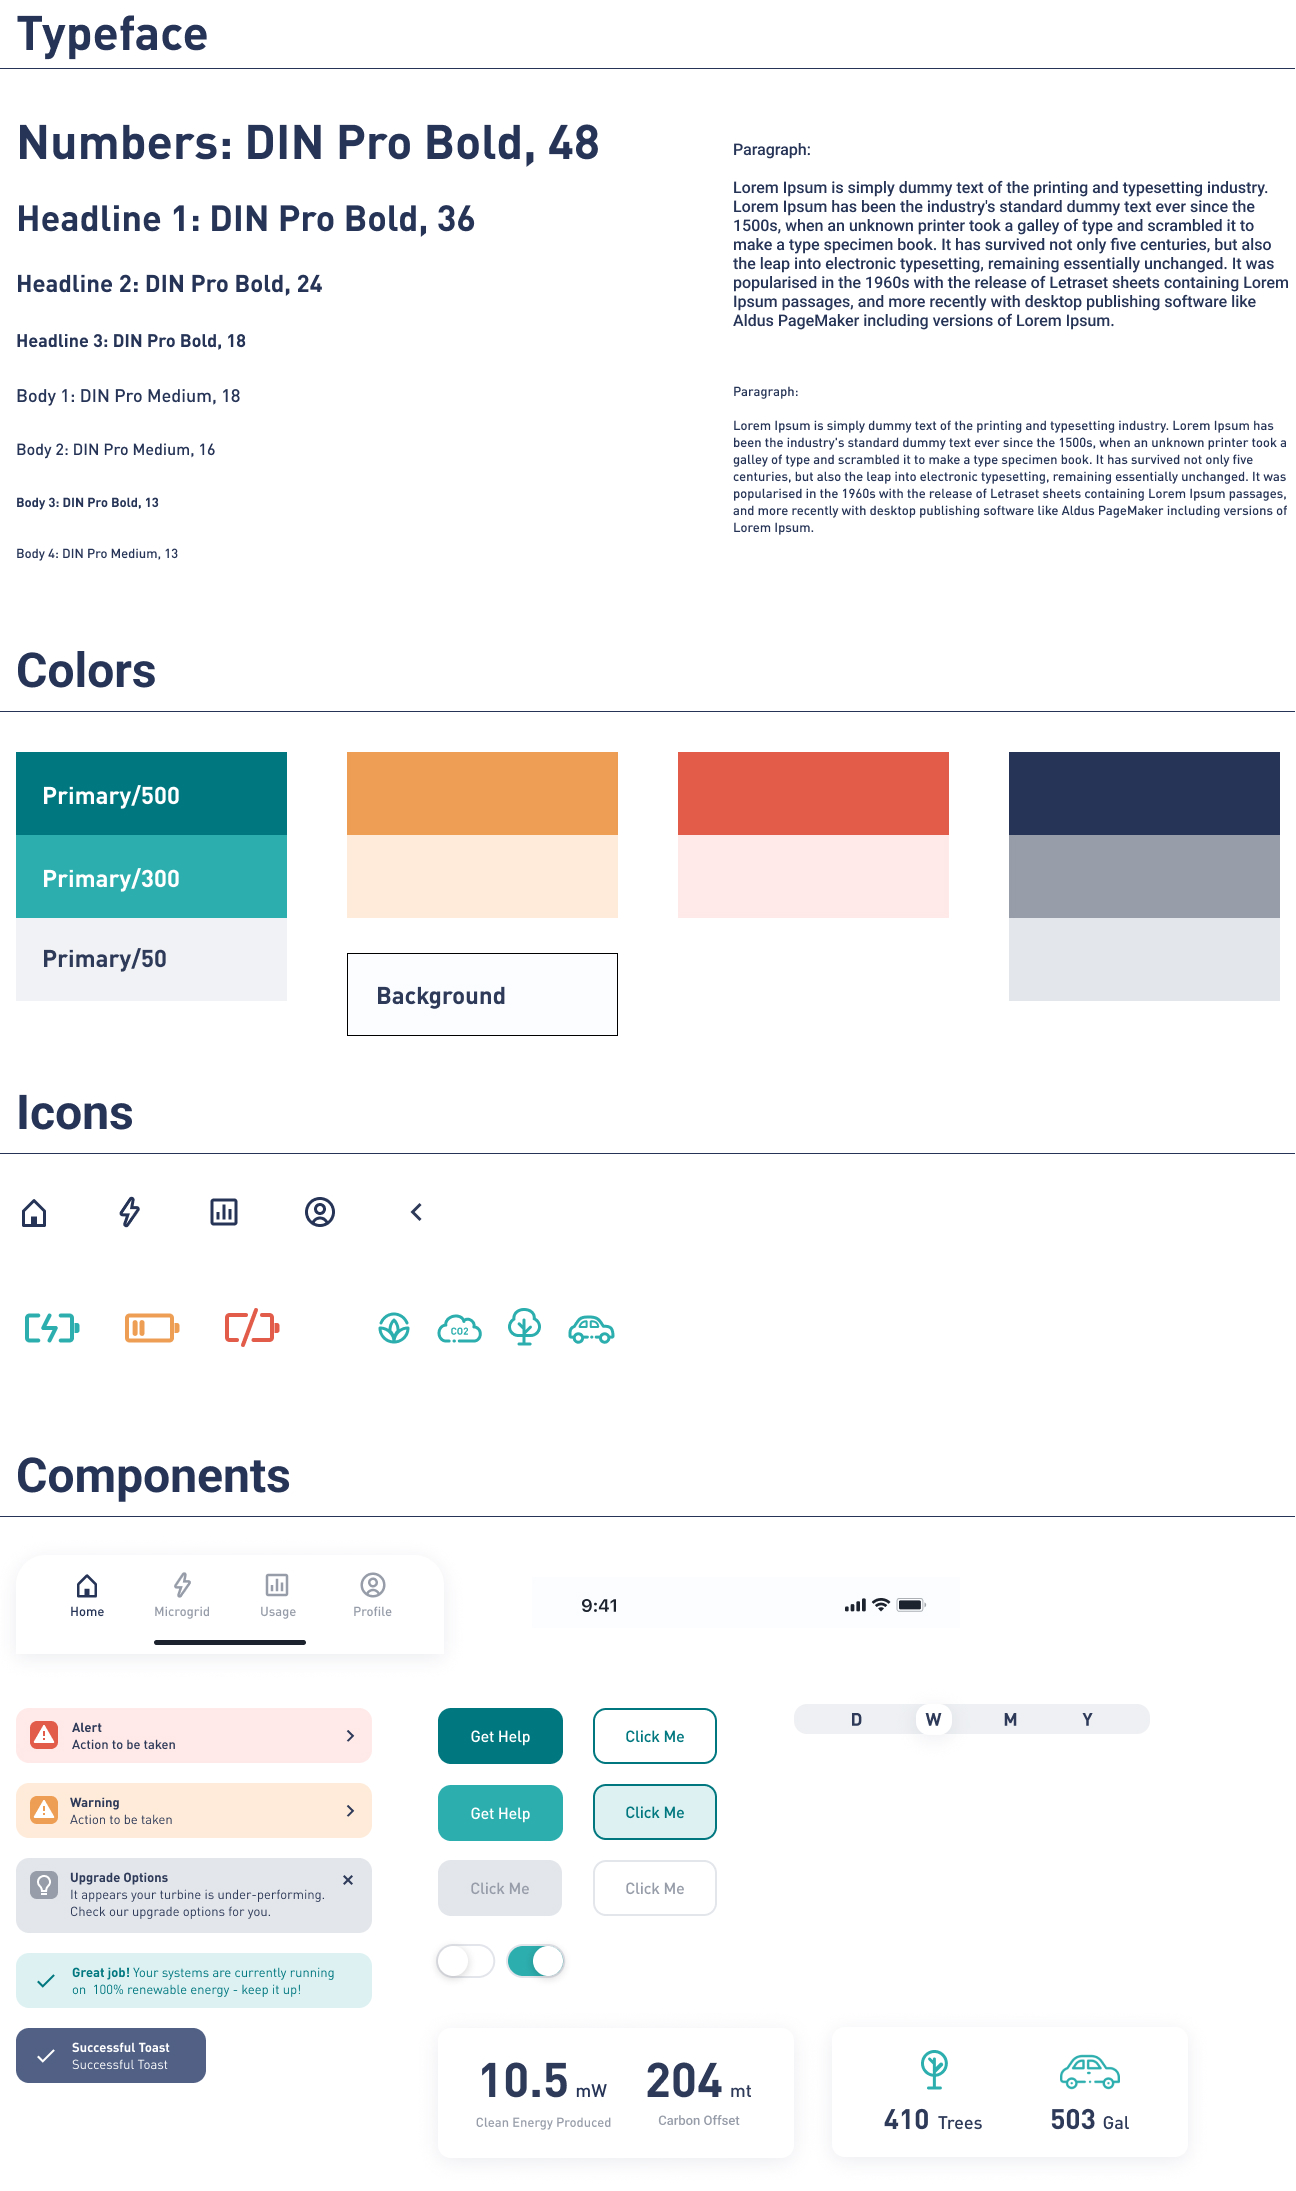
UI KIT: Building brand Consistency
To unify the design system, my teammates and I put together a UI kit. I chose the colors and fonts according to WindStax's brand voice of trustworthiness and optimism. I also custom-made the icons!

reflection
Sustainability is one of my core values. I relished in the technical challenge presented by the nuts and bolts involved in the move to renewable energy. Furthermore, WindStax was a welcome empathy exercise in researching the contexts of remote microgrid customers and the unique challenges they face. Finally, I was heavily involved in every aspect of this design project and feel I was able to shape the final product to my vision.
The next steps for this project include testing on actual microgrid customers. Due to the constraints of the design sprint, we only ran heuristic evaluation and tests with other designers, but ultimately we need to put the app in front of real WindStax customers to see how it performs in meeting their goals. Stay tuned!


